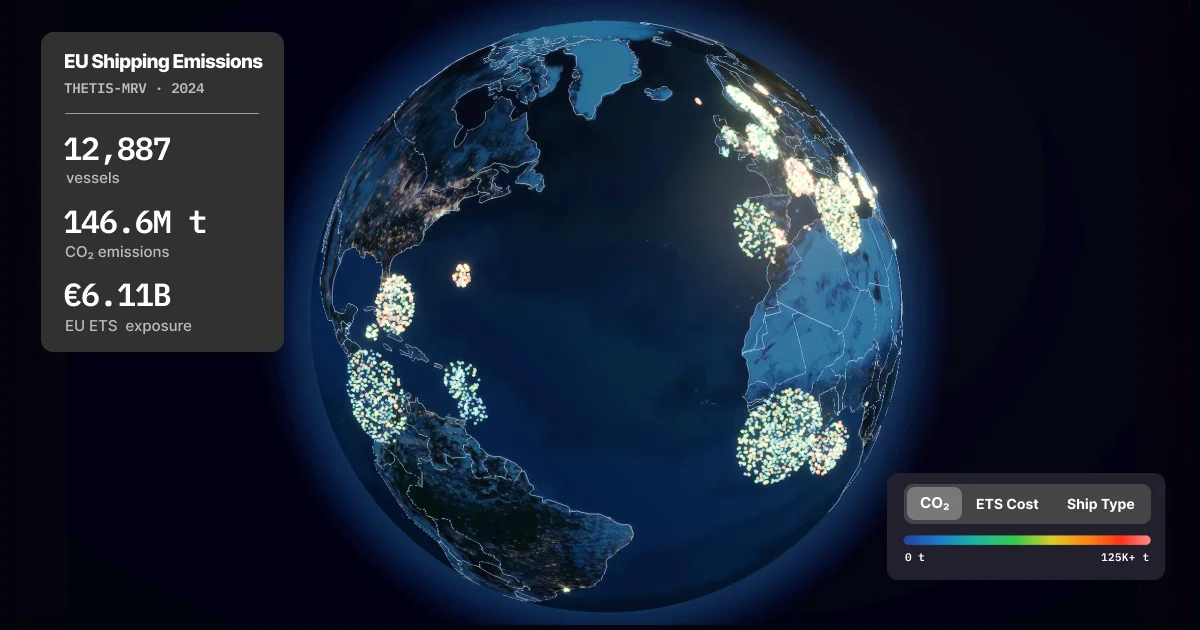
Interactive 3D globe of EU shipping emissions
Interactive 3D globe visualizing seven years of EU shipping emissions data (2018–2024) from THETIS-MRV. 12,000+ vessels per year, filterable by ship type, flag state, and emissions metrics.
Reactions (1)
Similar products
by description similarity
Flight-Viz
flight-viz.com10K flights on a 3D globe in 3.5MB of Rust+WASM
3D models and more
Baltic shadow fleet tracker
github.comlive AIS, cable proximity alerts
Live 3D satellite tracker and the declassified Pentagon UFO archive
skylens.yantraai.appSee what satellites are flying over your location right now — a live 3D tracker for the ISS, Starlink trains, and 16,000+ satellites. Plus NASA asteroid data and 375 declassified UAP files. Free, no signup.
Global Maritime Chokepoints
ryanshook.orgInteractive reference guide to the world's most critical maritime chokepoints, updated August 2026 — with the Strait of Hormuz closed and the Red Sea under a Houthi blockade. Explore an interactive D3.js map of 18 strategic straits and waterways that control global trade, energy supply chains, and naval power projection.